UNIT 5: Rational explorations: numbers and their opposites
IN THIS UNIT, STUDENTS WILL BE EXPECTED TO:
- Understand that positive and negative numbers are used together to describe quantities having opposite directions or values.
- Understand that opposites add to equal zero.
- Understand a rational number as a point on the number line.
- Recognize opposite signs of numbers as indicating locations on opposite sides of 0 on the number line.
- Recognize that the opposite of the opposite of a number is the number itself.
- Find and position integers and other rational numbers on a horizontal or vertical number line diagram.
- Understand the ordering and absolute value of rational numbers.
- Interpret statements of inequality as statements about the relative position of two numbers on a number line diagram.
- Write, interpret, and explain statements of order for rational numbers in real-world contexts.
- Understand the absolute value of a rational number as its distance from 0 on the number line
- Interpret absolute value as magnitude for a positive or negative quantity in a real-world situation.
- Distinguish comparisons of absolute value from statements about order.
LEARNING OBJECTIVES:
6.NR.3. Solve a variety of problems involving whole numbers and their opposites; model rational numbers on a number line to describe problems presented in relevant, mathematical situations.
6.NR.3.1. Identify and compare integers and explain the meaning of zero based on multiple authentic situations.
6.NR.3.2. Order and plot integers on a number line and use distance from zero to discover the connection between integers and their opposites.
6.NR.3.3. Recognize and explain that opposite signs of integers indicate locations on opposite sides of zero on the number line; recognize and explain that the opposite of a number is the number itself.
6.NR.3.4. Write, interpret, and explain statements of order for rational numbers in authentic, mathematical situations. Compare rational numbers including integers, using equality and inequality symbols.
6.NR.3.5. Explain the absolute value of a rational number as its distance from zero on the number line; interpret absolute value as the distance for a positive or negative quantity in a relevant situation.
6.NR.3.6. Distinguish comparisons of absolute value from statements about order.
6.NR.2. Apply operations with whole numbers, fractions, and decimals within relevant applications.
6.NR.2.3. Interpret numerical data to answer a statistical investigative question created. Describe the distribution of a quantitative (numerical) variable collected, including its center, variability, and overall shape.
6.NR.2.4. Design simple experiments and collect data. Use data gathered from realistic scenarios and simulations to determine quantitative measures of center (median and/or mean) and variability (interquartile range and range). Use these quantities to draw conclusions about the data, compare different numerical data sets, and make predictions.
LEARNING TARGETS (I Can Statements):
- I can explain that positive and negative numbers describe quantities that have opposite directions or values (e.g., temperature above/below zero, elevation above/below sea level, debits/credits, positive/negative electric charge).
- I can use positive and negative numbers to represent quantities in authentic (real-world) situations and explain the meaning of zero based on each situation.
- I can interpret relevant mathematical problems related to positive and negative numbers.
- I can explain where zero fits into a situation represented by integers.
- I can find and position integers and other rational numbers on a horizontal or vertical number line diagram.
- I can identify the location of zero on a number line in relation to positive and negative numbers.
- I can explain that zero is its own opposite.
- I can recognize opposite signs of numbers as locations on opposite sides of zero on the number line.
- I can interpret the meaning of numerical statements of inequality as the relative position of two integers positioned on a number line. For example, interpret that –3 is located to the right of –7 on a horizontal number line.
- I can write, interpret, and explain statements of order for rational numbers in real-world contexts. For example –3 degrees is warmer than –7 degrees.
- I can identify rational numbers as a fraction where the numerator and denominator are integers.
- I can identify the absolute value of rational numbers.
- I can explain the absolute value of a rational number as its distance from zero.
- I can compare absolute value statements from real-world situations about an order.
- I can describe the distribution of quantitative (numerical) data including its center (median and mean), variability (interquartile range (IQR), mean absolute deviation (MAD), and range), and overall shape (symmetrical vs nonsymmetrical).
- I can describe the nature of an investigation (how it was measured and its units of measurement).
- I can apply my understanding of absolute value in the context of MAD.
- I can use quantitative measures of center and variability to draw conclusions and make predictions about data sets.
- I can identify that each quartile represents 25% of the data set.
TEXTBOOK CONNECTIONS:
(Use Georgia Reveal Math - Course 1 - 6th Grade)
Module 4 – Integers and Rational Numbers
Plot integers and rational numbers on number lines.
Lesson 4-1 Represent Integers
Students will use integers on a number line to represent quantities.
Lesson 4-2 Opposites and Absolute Value
Students will find the opposites of integers and use opposites to understand absolute value.
Lesson 4-3 Compare and Order Integers
Students will compare and order integers using a number line.
Lesson 4-4 Rational Numbers
Students will reason about rational numbers using a number line.
Module 10 – Statistical Measures and Displays
Find and use statistical measures.
Lesson 10-3 Measures of Center
Students will understand and apply different measures of center.
Lesson 10-4 Interquartile Range and Box Plots
Students will understand the interquartile range and construct box plots.
Lesson 10-5 Mean Absolute Deviation
Students will understand mean absolute deviation.
Lesson 10-6 Outliers
Students will understand outliers and their effect on measures of center.
Lesson 10-7 Interpret Graphical Displays
Students will interpret dot plots, histograms, and box plots.
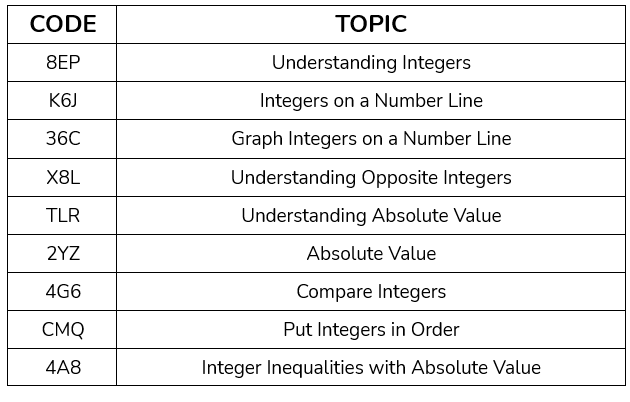
IXL SKILLS: